
AI risk of bias assessment is the use of a large language model (LLM) to rate the risk of bias of each study in a systematic review. In a 2026 study that our team co-authored, GPT-5-mini matched the expert consensus in 64.5% of 1,007 ratings. Each expert reviewer matched it 87.5% and 91.4%. When the model disagreed, it was almost always stricter than the experts. The authors conclude that an LLM can flag ratings for a human to check, but it is not ready to act as the second reviewer.
The paper is "Large Language Model Risk of Bias Assessment for Studies in Environmental Health: A Proof of Concept Study." The authors are Gaelen Adam, Eitan Agai, Riaz Qureshi, Naeem Meman, Stephanie Qureshi, Winifred Yu, Juleen Lam, and Karen Robinson. JMIR Bioinformatics and Biotechnology accepted it in 2026. Several of the authors work for PICO Portal. Authors not employed by PICO Portal did all the analyses. The data and the analysis code are public, and the protocol was registered before the work started. Every chart below is drawn from that data or from the paper’s tables.
What risk of bias assessment is and why teams want help with it
Risk of bias assessment is the step of a systematic review where reviewers judge how likely each study’s methods are to distort the result. A tool splits the judgment into domains, such as selection bias, confounding, and missing outcome data. Depending on the tool, each study gets one rating in each domain.
The usual standard is two reviewers who rate independently, then agree on one rating. It is slow, and reviewers disagree more than most teams expect. That is the work teams hope a model can share.
Most published tests of LLMs used randomized trials and the Cochrane tools. This study used observational studies of environmental exposures, where the judgments are harder to standardize.
How the study tested the model
The studies. The reference set came from the systematic review behind the National Academies’ 2022 guidance on PFAS exposure, testing and clinical follow-up. That review included 139 studies. The 128 open-access studies went into the test.
The tool. The team used the Navigation Guide, a risk of bias method built for environmental health. It has nine domains. The test used eight; the ninth, “other,” cannot be standardized due to its broadness. Each rating is low, probably low, probably high, or high.
The reference standard. Two experienced reviewers rated every study independently. For each domain, they quoted the passages from the study that justified their rating, and gave personal reasons and rationale for their judgment. Their agreed rating is the consensus.
The model. GPT-5-mini, through Azure OpenAI, got the same guidance the reviewers had, a generic prompt, and the reviewers’ quoted passages. It had no extra training and no access to the reviewers’ reasons. For each study and domain, it returned a rating and a written reason. Gemini 3 ran the same test as a check. With a few domains that had no usable passage, the test held 1,007 ratings (paper, results).
How often AI risk of bias assessment matched the experts
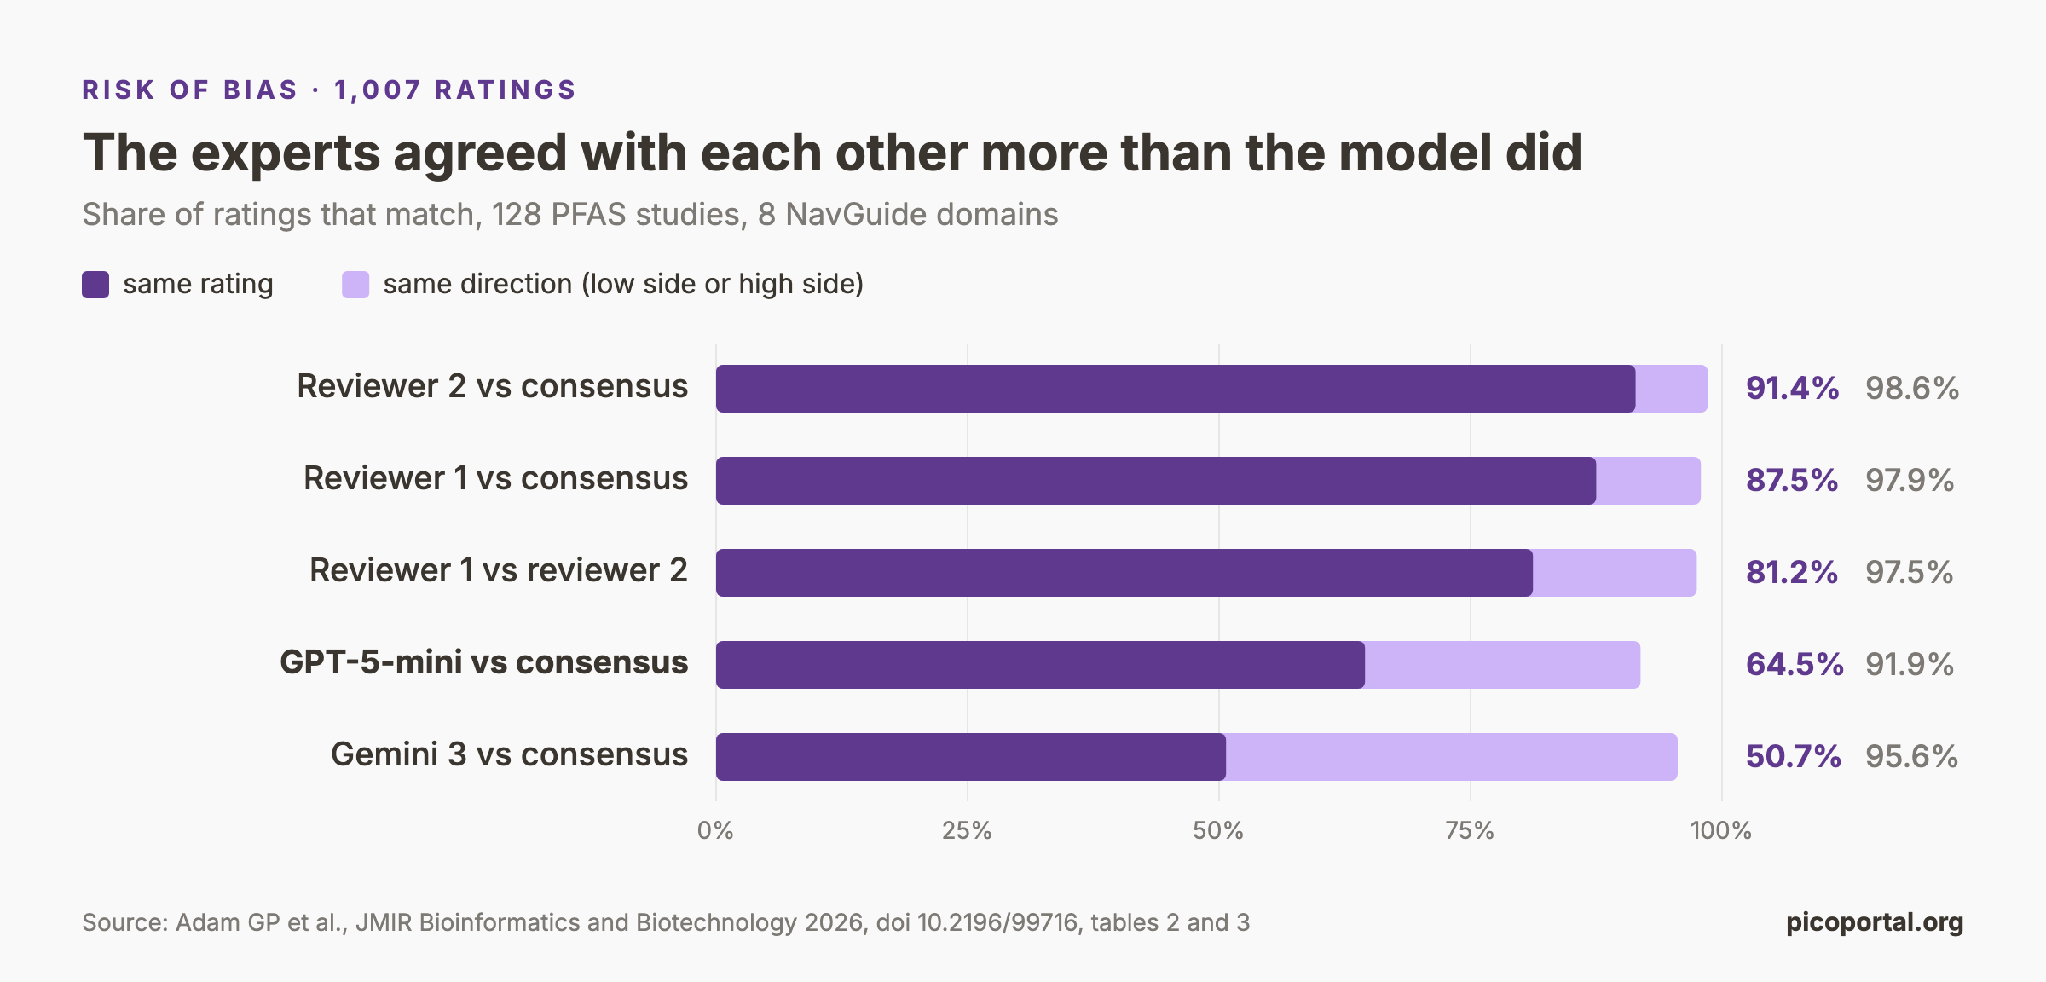
Figure 1. How often each rater matched the expert consensus, exactly and in direction (Adam et al. 2026, tables 2 and 3).
Exact agreement. GPT-5-mini gave the consensus rating in 64.5% of cases (paper, table 2). The two reviewers matched the consensus in 87.5% and 91.4%, and matched each other in 81.2%. Gemini 3 reached 50.7%.
Agreement in direction. The authors also counted a match when both ratings were on the same side of the scale, such as low and probably low (paper, table 3). On that count, GPT-5-mini reached 91.9%, Gemini 3 reached 95.6%, and the reviewers reached 97.9% and 98.6%.
A gap of one step on the same side rarely changes the conclusion of a review. A gap across the middle of the scale can. That is why the second number matters.
Kappa and Gwet’s AC2 give opposite verdicts
For exact matches, the weighted Cohen’s kappa of GPT-5-mini against the consensus was 0.199, which reads as poor (paper, table 2). Gwet’s AC2 for the same ratings was 0.882, which reads as almost perfect.
The reason is the data: 924 of the 1,007 consensus ratings were low risk (public data). When one category holds most of the ratings, kappa assumes that most agreement happens by chance, and the score falls. The same effect pulled down the kappa between the two human reviewers. When you read a kappa in an LLM study, also read the plain percentage and the share of each category.
Agreement by domain: from selection bias to outcome assessment
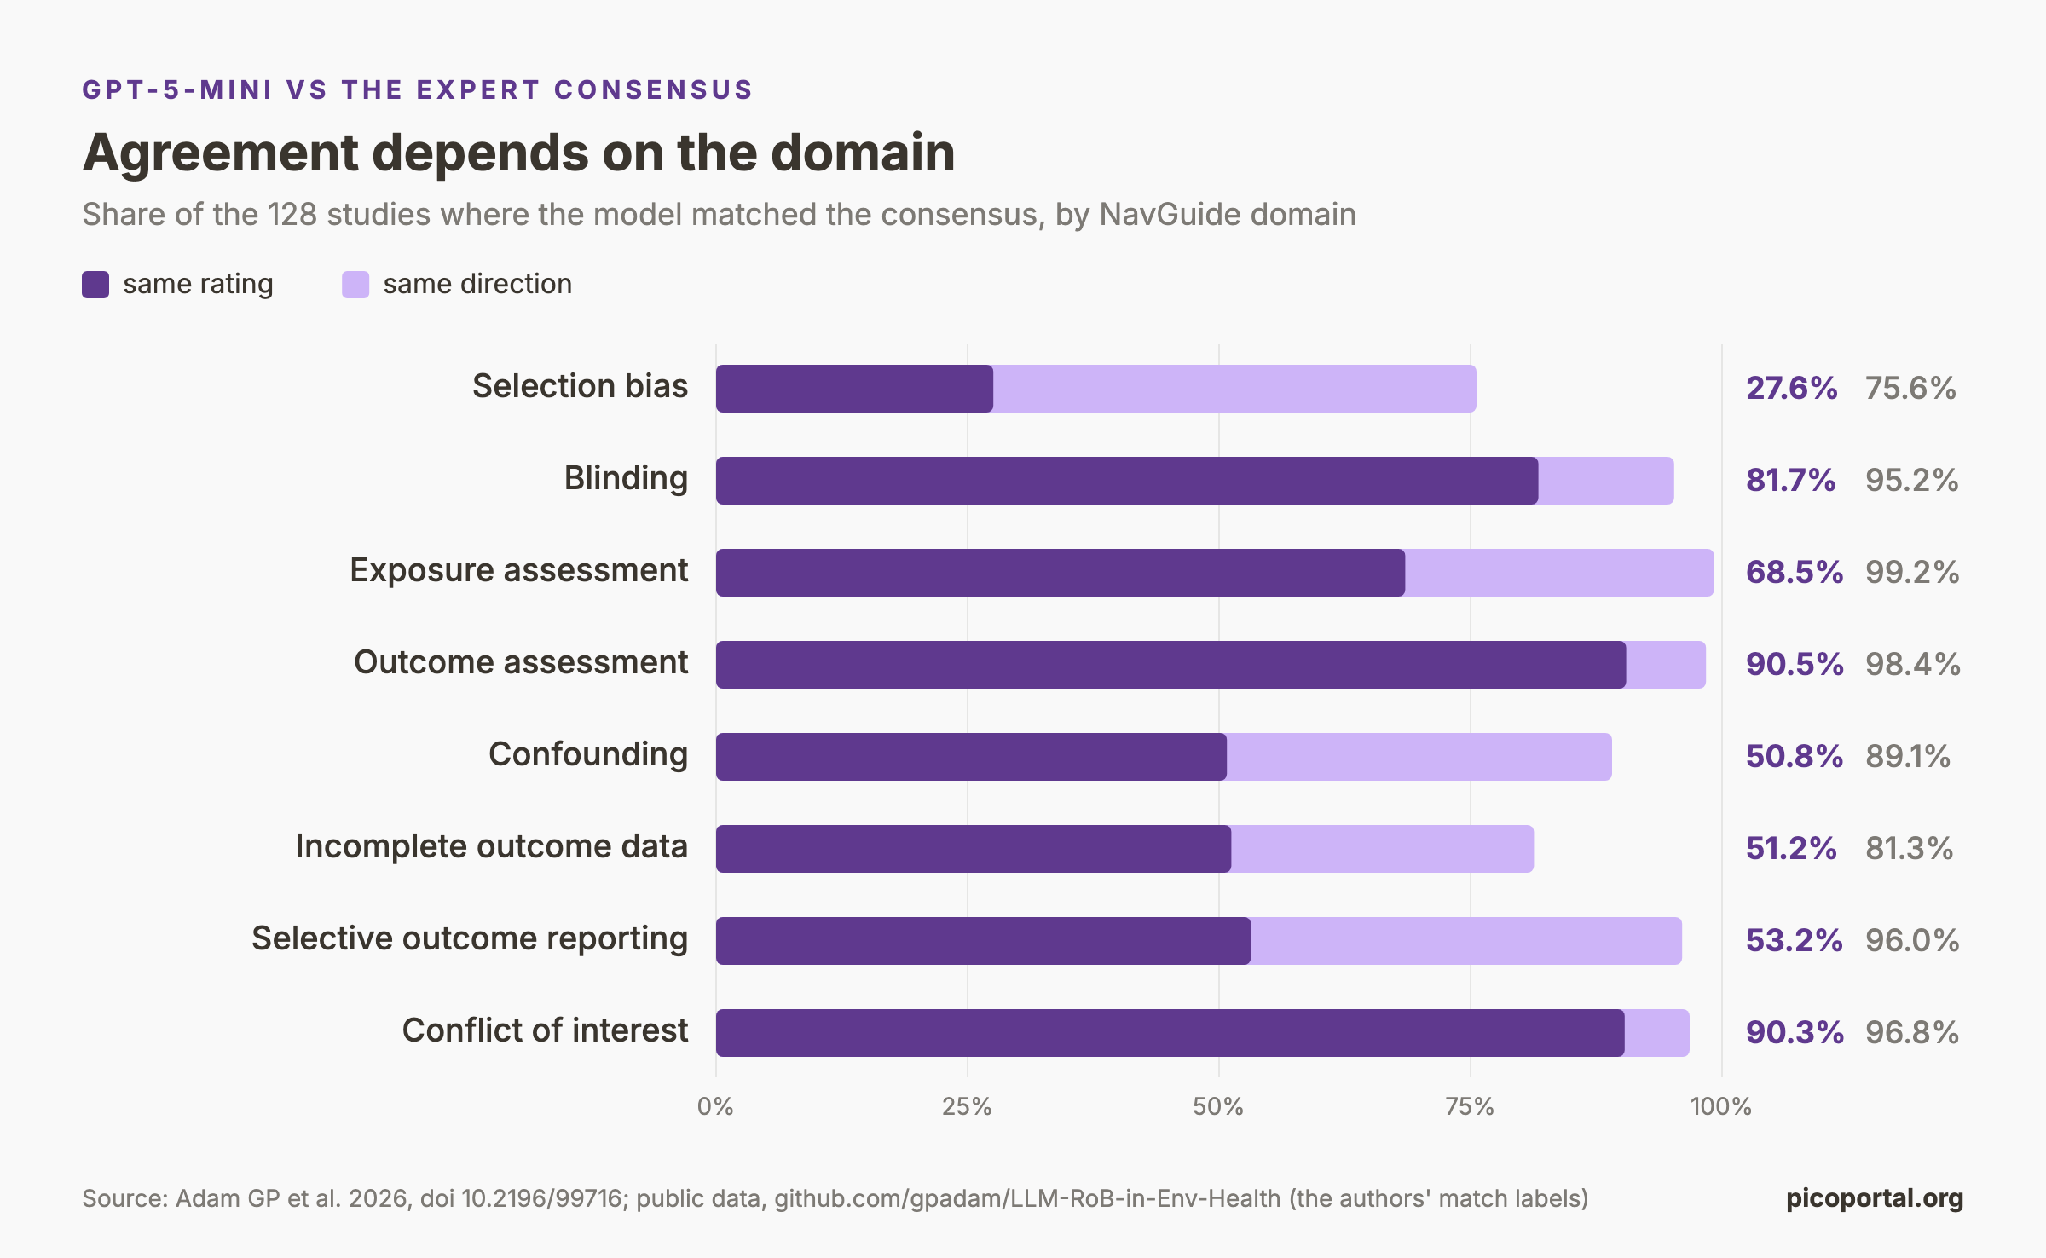
Figure 2. How often GPT-5-mini matched the expert consensus in each Navigation Guide domain, 128 studies (public data).
The average hides a wide range (public data). The model matched the consensus in 90.5% of studies for outcome assessment and 90.3% for conflict of interest. For selection bias, it matched 27.6%.
The difference follows the kind of question. Conflict of interest asks who paid for the study, and the answer is usually one sentence. Selection bias asks if the people in a study represent the population they came from. That needs judgment about the whole design, and that judgment is where the model fell short.
The model was stricter than the reviewers
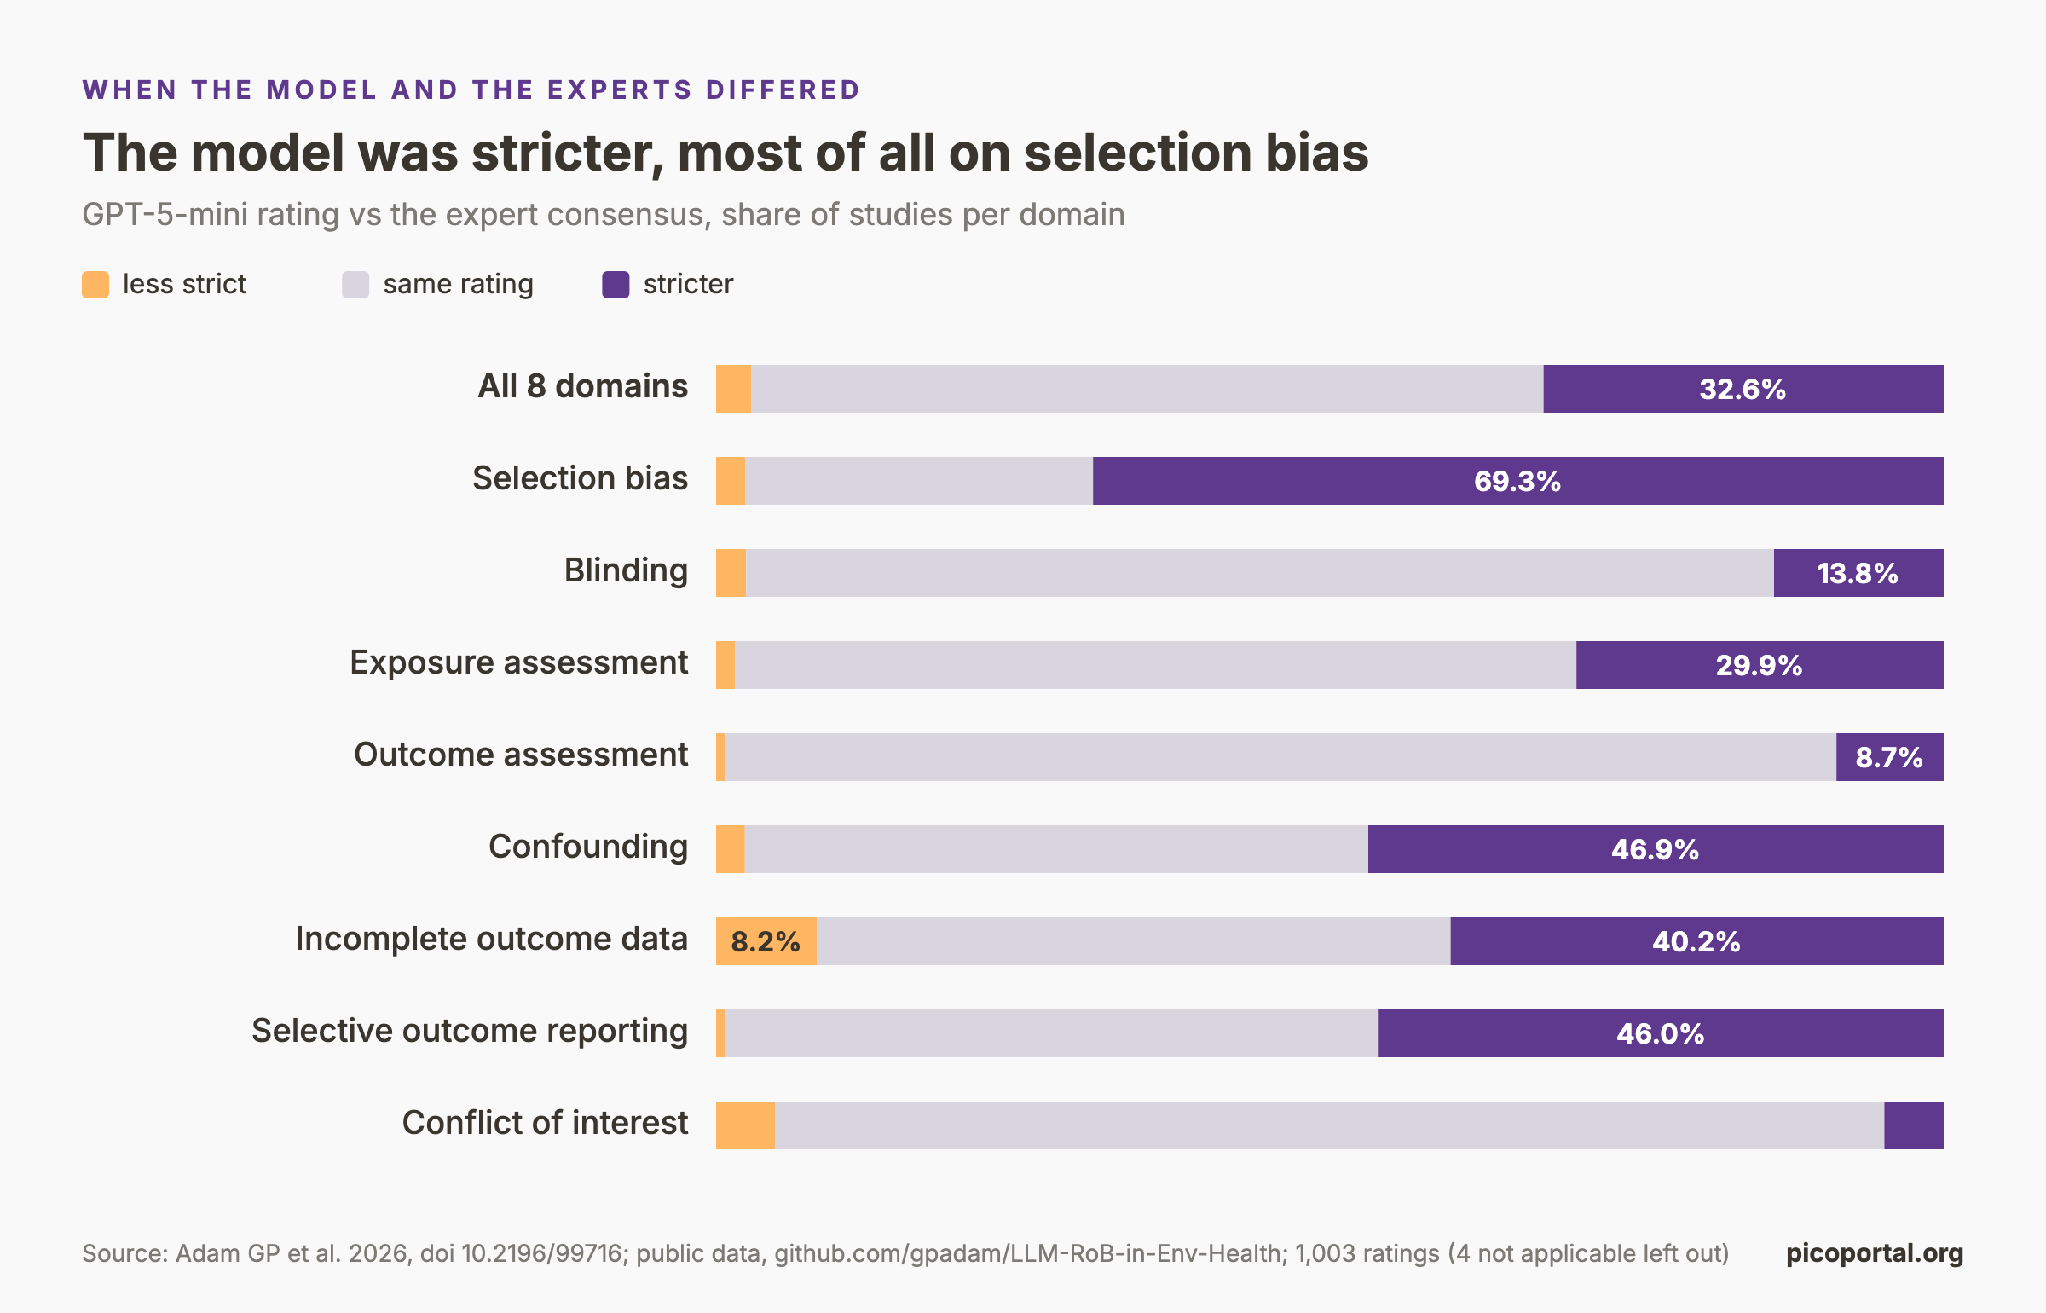
Figure 3. GPT-5-mini rating against the expert consensus, per domain (public data, 1,003 ratings).
Across all domains, the model was stricter than the consensus in 32.6% of ratings and less strict in 2.9% (public data). In selection bias, it was stricter for 69.3% of studies. The reviewers rated no study as high risk in any domain. The model did, 36 times.
Missing information drove the conflicts
The authors read the reasons of both sides for every rating that did not match. One pattern explained most of the gap. When a study did not report a detail, the reviewers assumed that the method was acceptable. The model treated the gap as a possible source of bias. On average across domains, 40% of the conflicts came from that difference (paper, results).
Selective outcome reporting is the clearest case (paper, results). Of 54 ratings where the model was one step stricter, 52 had one reason: the study had no published protocol. In selection bias, the model marked studies down when the sample was a subset of a larger cohort, or when participants dropped out.
The authors add a second pattern. The model often judged real studies against an ideal design, while the experts judged them against what is practical in the field.
Who was right when the model and the reviewers disagreed
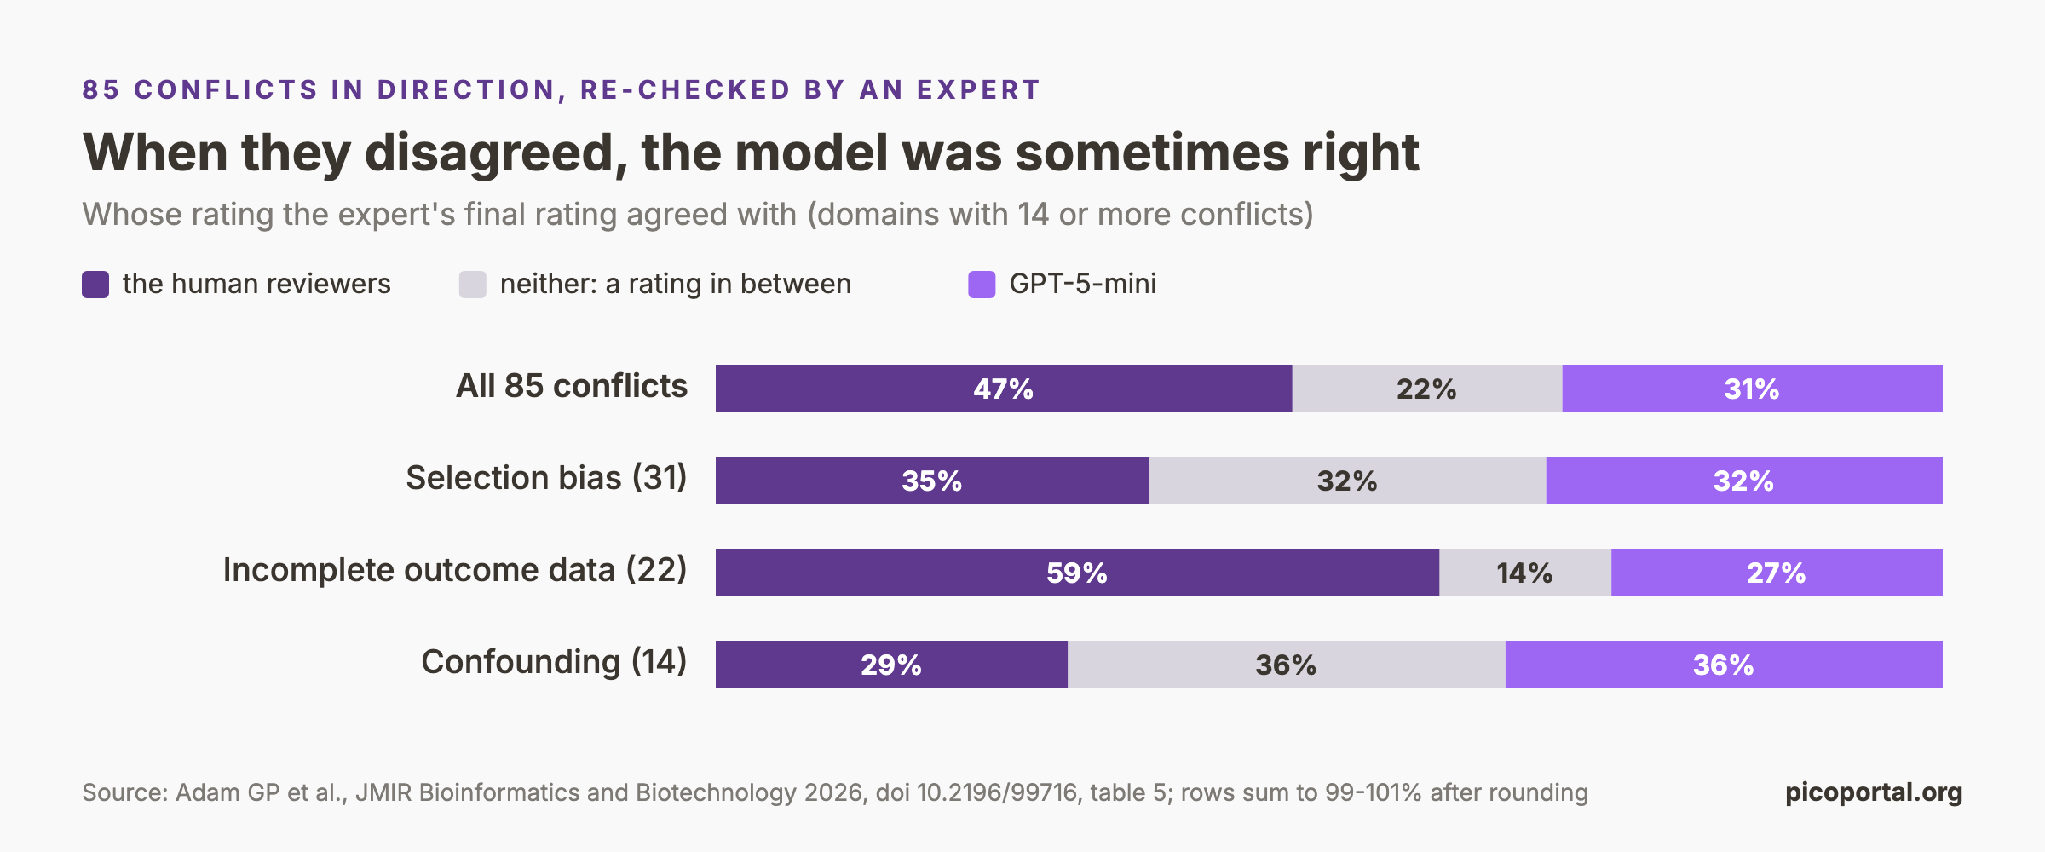
Figure 4. 85 conflicts in direction: whose rating the expert’s final rating agreed with (Adam et al. 2026, table 5).
In 85 ratings, 8% of the total, the model and the consensus were on opposite sides of the scale (paper, table 5). A subject expert read both reasons and rated each one again.
The final rating agreed with the reviewers in 47% of these cases and with the model in 31% (paper, table 5). In 22%, the right answer was between the two. The split changes by domain. In confounding, the expert agreed with the model more often than with the reviewers: 36% against 29%. In blinding and in outcome assessment, the reviewers were right in every conflict.
The authors estimate that the model’s ratings changed the final rating in about 4% of studies. That is the case for the model as a check. It is wrong more often than a reviewer, and it still finds some real problems that the reviewers missed.
Consistency across five runs, and the full-text test
Five runs. The team sent every rating to the model five times (paper, table 4). All five runs gave the same rating in 62% of cases and the same direction in 90%. Consistency followed the domains: all five runs agreed in 32% of cases for selection bias and in 90% for conflict of interest. A majority vote of the five runs matched the consensus in 64% of cases, against 64.5% for the first run alone. More runs did not help.
The full text. In a second test, the model found its own passages in the full-text PDF and rated using them. Its closest passage was near in meaning to a reviewer’s passage, with a median similarity of 0.92. Agreement with the consensus was 74.4% exact and 92.4% in direction.
The cost. The authors estimate about $0.006 per article with GPT-5-mini and $0.011 with Gemini 3 Flash.
How to use an LLM for risk of bias today
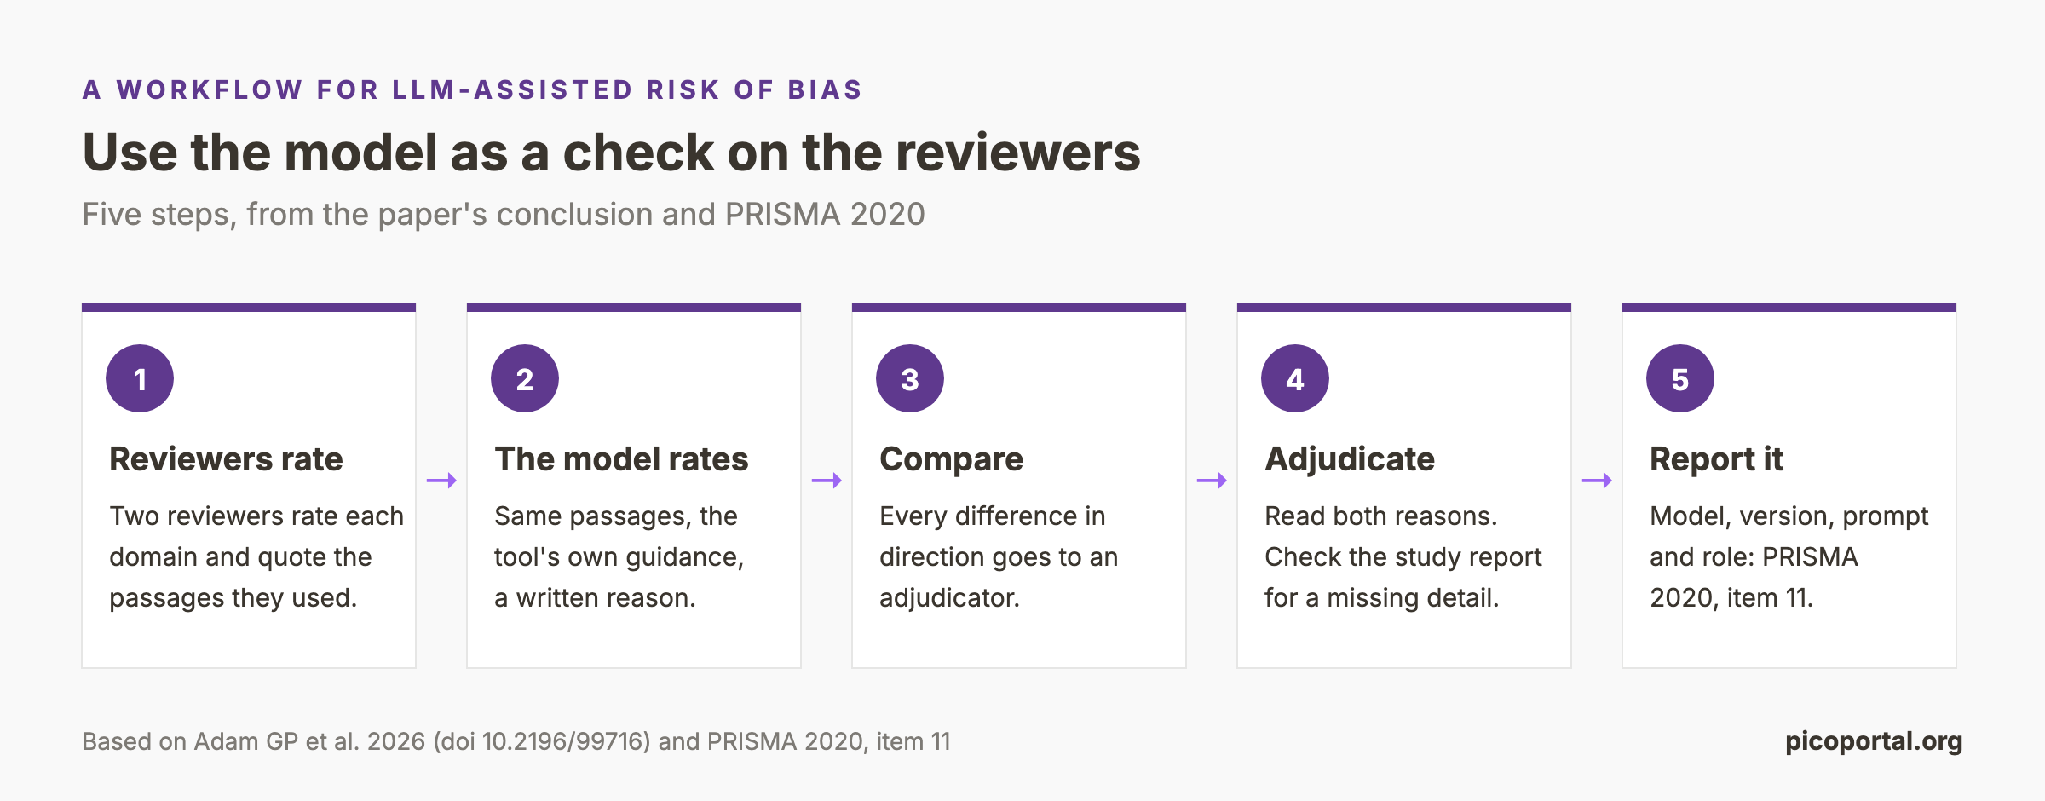
Figure 5. Five steps for LLM-assisted risk of bias, from the paper’s conclusion and PRISMA 2020, item 11.
The paper supports one role for the model: a check on the reviewers. A procedure for that role:
1. Let two reviewers rate each domain independently. Ask them to quote the passages that they used.
2. Give the model the same passages and the tool’s own guidance. Ask for a rating and a reason.
3. Send every difference in direction to an adjudicator.
4. Tell the adjudicator to read both reasons and to check the study report for the missing detail.
5. Record the model, its version, the prompt and its role in the review.
PRISMA 2020, item 11, asks reviews to report “details of automation tools used in the process” of risk of bias assessment. Step 5 gives you that text. Our guide to the PRISMA 2020 flow diagram covers the rest of the reporting.
Two more rules follow from the results. Check the model hardest in the domains that need judgment about the whole design, such as selection bias and confounding. Treat one run as one opinion, and report every setting that you use.
Limits of the study
- One review: all 128 studies came from one systematic review on one topic. Results may differ in other fields.
- Open access only: open-access studies can differ from paywalled studies in funding, design, and quality.
- Almost no high-risk studies: the consensus held no high rating and 25 probably high ratings (public data). The test says little about weak studies.
- Human passages: in the main test, the reviewers chose the passages. The model did not have to find the evidence itself.
- Model reasons: a model’s written reason is generated text. It is not a validated record of how the model reached its rating.
Where to go next
PICO Portal runs risk of bias assessment on built-in or custom forms. Each project chooses single review, single review with a quality check, or dual independent review with a Judicator who resolves discrepancies. The features page shows how risk of bias fits with screening and extraction in one workspace.
- Systematic review: what it is and how one is done. The method that risk of bias assessment sits inside.
- Meta-analysis: how to read a forest plot. What happens to the ratings when the studies are pooled.
- Risk of bias assessment in PICO Portal. The help page for the form.