
A PRISMA flow diagram accounts for every record a systematic review found, from the thousands a search returns to the studies the review includes. Each box holds a count and each arrow a subtraction, so a reader can check the whole chain.
That check is why reviewers ask for it. The diagram shows that these studies, and no others, were included, and that everything else was left at a stated point for a stated reason. Every stage of a systematic review leaves a number in it, from the first search to the last full-text decision.
Cochrane expects a PRISMA-type diagram in every review. The NICE guidelines manual asks for one in each evidence review, and journals that endorse PRISMA ask authors to use one.
This guide walks through the 2020 template box by box, describing three errors reviewers often flag, the changes since 2009, the extensions, and the checklists.
The phases of the PRISMA 2020 flow diagram
The PRISMA 2020 statement, published in The BMJ in 2021, replaced the 2009 statement and its diagram. The template runs down three phases: Identification, Screening, and Included.
Three nouns carry the diagram, and the statement’s glossary defines each. A record is the title or abstract of a report as indexed in a database. A report is a document about a study: a journal article, preprint, conference abstract, register entry, or dissertation. A study is the investigation itself, and one study can have several reports. The top of the diagram counts records, the middle counts reports, and the bottom counts studies and reports together.
One rule runs down the page. Each box in the main chain equals the box above it, minus the box beside it.
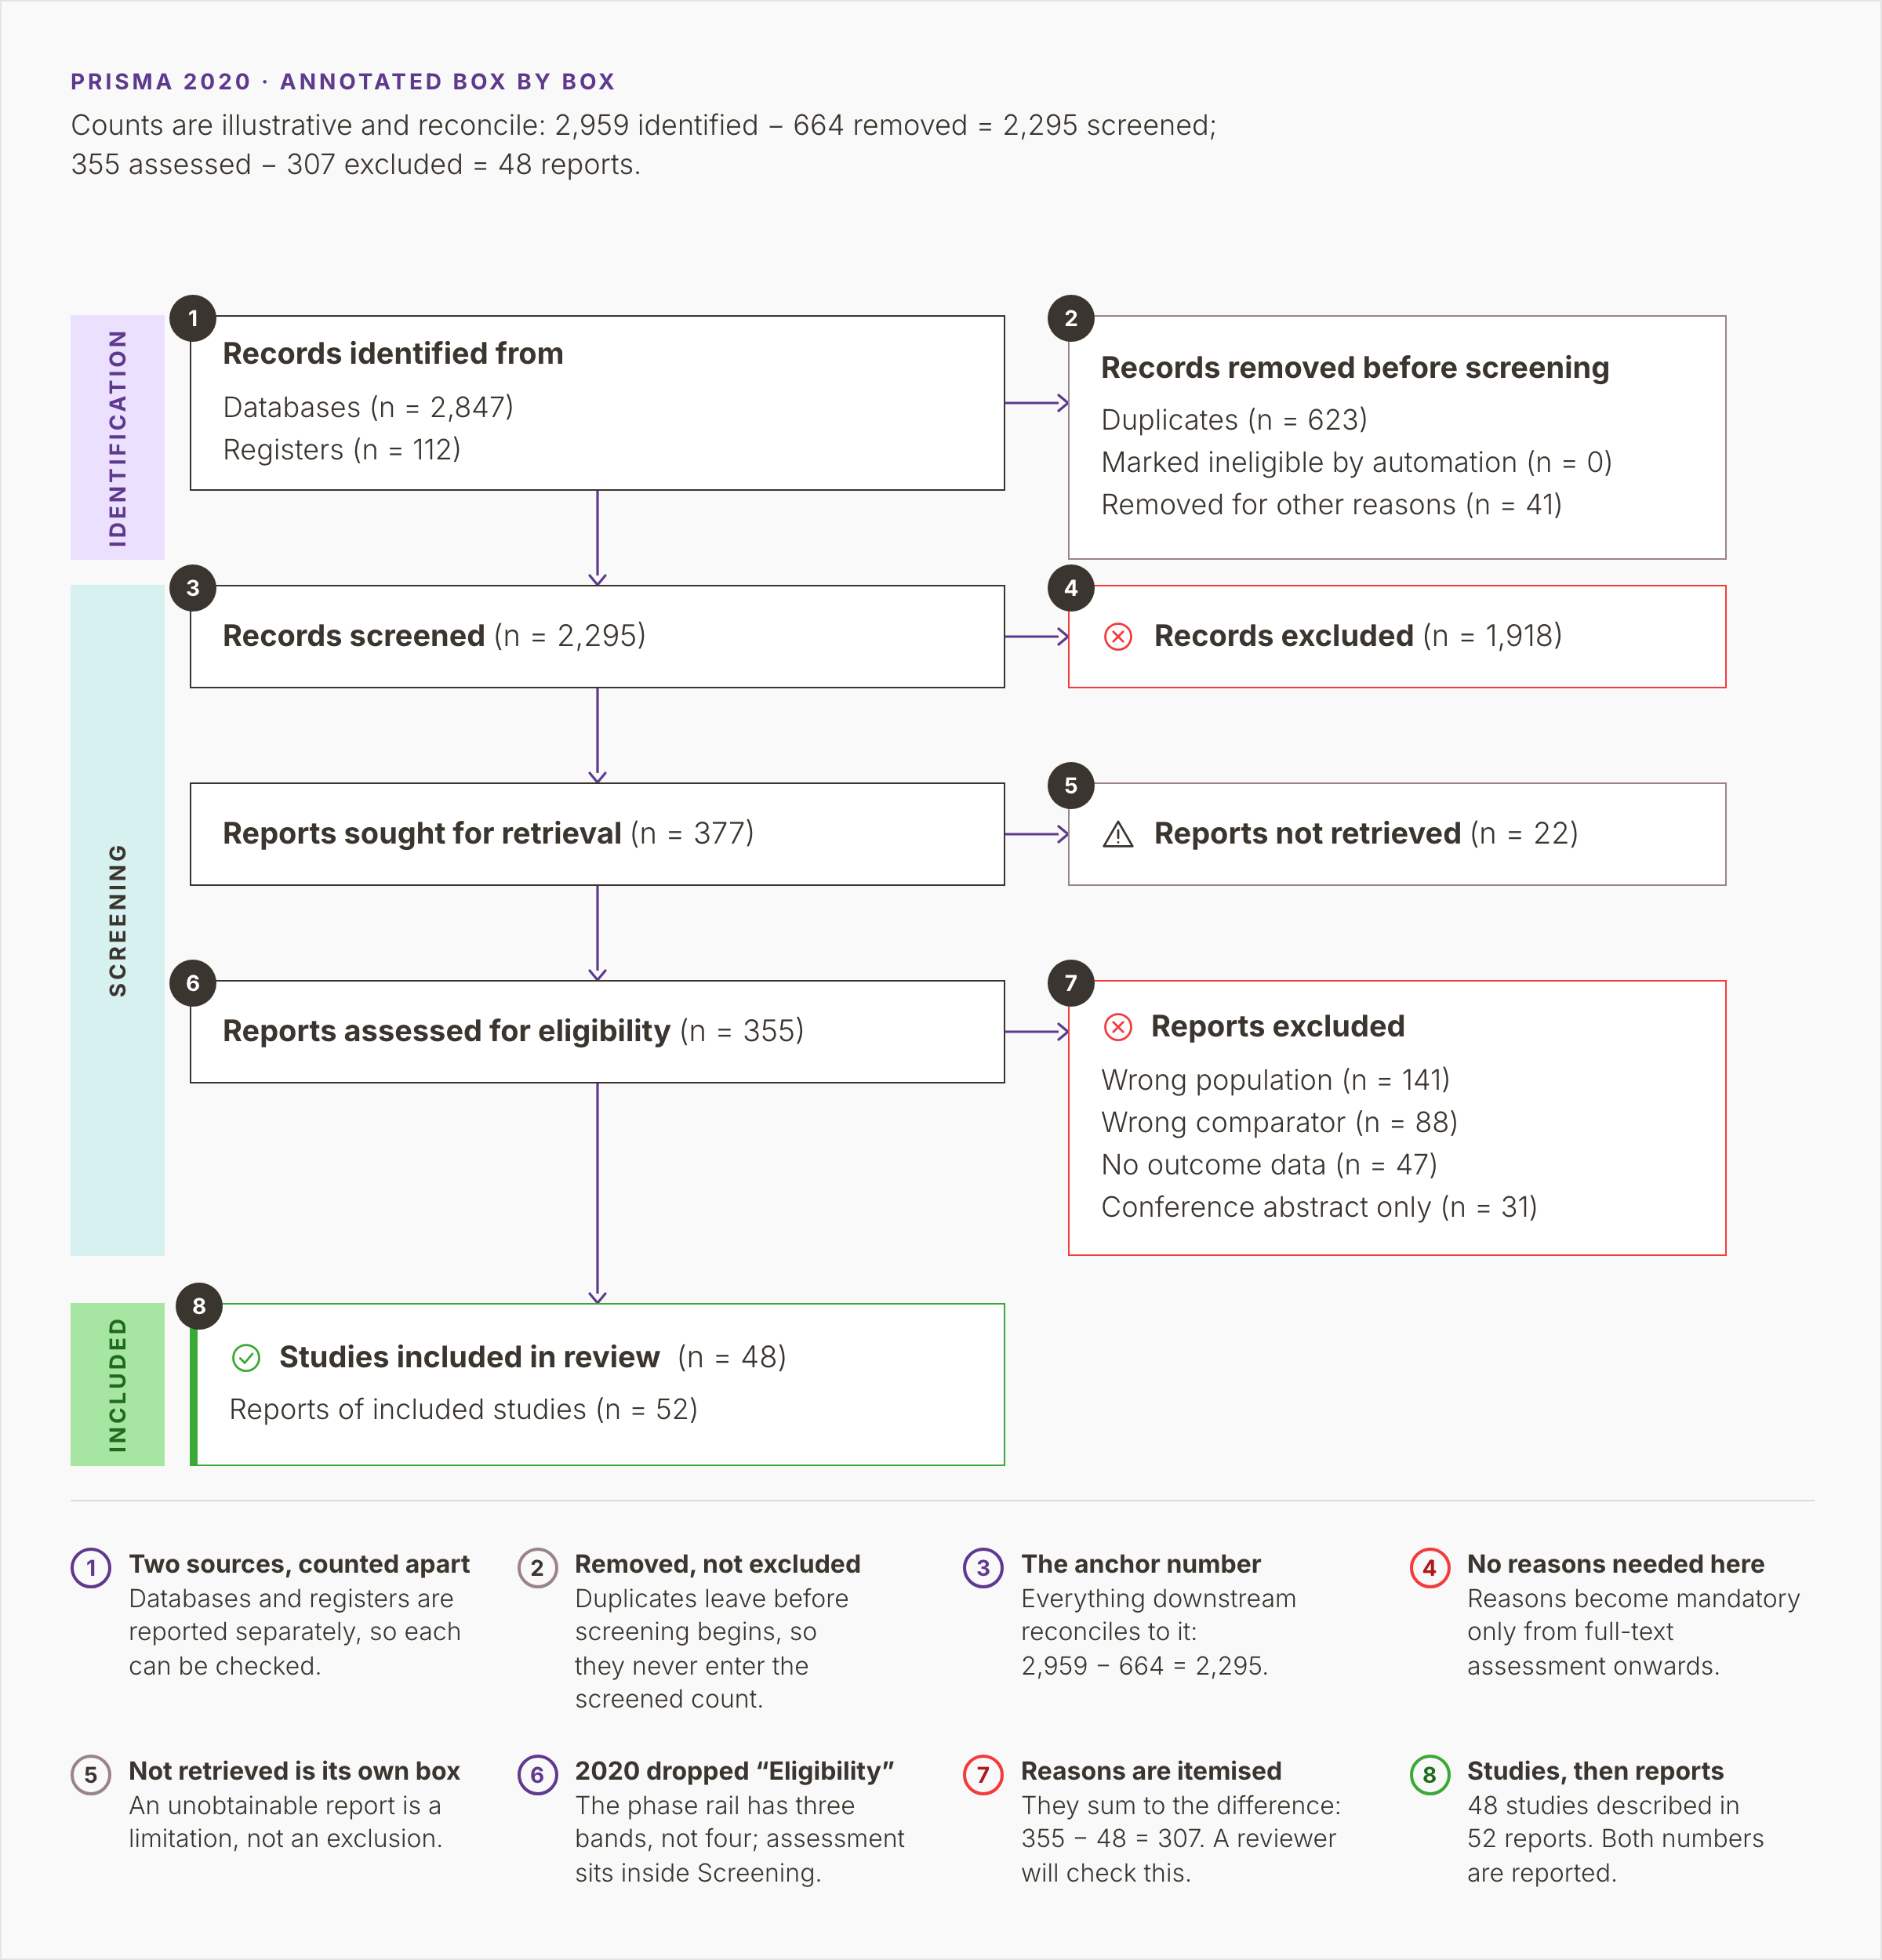
Figure 1. The databases-and-registers column of a PRISMA 2020 diagram, with numbered callouts and illustrative counts that run from 2,959 records identified to 48 reports leaving full-text assessment and a final box of 48 studies in 52 reports included.
Identification
Identification holds everything the searches returned. The first column counts records from databases and records from registers on separate lines: 2,847 and 112 in V1. Registers here means trial registries, such as ClinicalTrials.gov, ISRCTN, and the WHO International Clinical Trials Registry Platform.
A second column, used when the review searched beyond databases and registers, counts records from websites, organisations, and citation searching. It carries its own retrieval and exclusion boxes and joins the first column at the bottom. V1 draws the first column only.
Citation searching can sit in either column. Rethlefsen and Page take up the question in a 2022 commentary in the Journal of the Medical Library Association. They suggest the second column for it and the first for subject searches, and accept either choice. Whichever you pick, state it in the methods and hold to it.
Beside the first column sits the box for records removed before screening. It has three lines: duplicates, records marked ineligible by automation tools, and records removed for other reasons.
Screening, with eligibility folded in
Screening runs in two passes: Records are screened at title and abstract, records excluded are counted beside them, and the remainder become reports sought for retrieval. Reports not retrieved come off next. What remains is assessed in full text, and the reports excluded at that stage are listed by reason.
In 2009 that second pass had its own phase, labelled Eligibility. PRISMA 2020 keeps the work and drops the phase, and V1’s phase rail shows three bands. The word survives in a single box label: “Reports assessed for eligibility.”
Included
The last box carries two numbers: studies included in the review, and reports of included studies. V1 shows 48 studies described in 52 reports. The templates for updated reviews add boxes for the studies and reports carried over from the previous version, so the diagram ends with a total. The abstract and the results section quote the studies figure too, and all three places must give the same number.
Where each number in the diagram comes from
Each count starts somewhere specific in the work and must reconcile with a partner. The figures below come from V1, a PRISMA flow diagram example with illustrative counts.
Records identified
The number is the results count of each search on the day it ran, checked against the size of the file exported from it. It lives in the search log, alongside the platform, the date and the full strategy. PRISMA-S, the PRISMA extension for reporting searches, asks in item 15 for the total from each database and each other source. Rethlefsen and Page advise putting the per-source counts in supplementary material where the diagram shows a combined figure.
Searches re-run before publication are added in: each database gets one figure covering the original search and every update. Google and Google Scholar show no more than 1,000 results per search, so no single search from either should be reported above that. V1’s 2,847 database records and 112 register records make 2,959.
Records removed before screening
The duplicates figure comes from the deduplication run in a reference manager or screening tool: records in, minus unique records out. PRISMA-S item 16 asks which process and software did the work. The PRISMA 2020 glossary draws the line: Records of the same report are duplicates; records of merely similar reports, such as a similar abstract submitted to two conferences, are unique.
Automated removals are records a machine classifier marked ineligible before anyone screened them. V1 prints that line as n = 0, which tells the reader no tool removed anything. The template gives removals for other reasons a single count. Itemise them anyway, retracted publications for instance, with a count for each. With 623 duplicates and 41 other removals, V1 takes 664 records out before screening.
Records screened and records excluded
Records screened is the anchor number. It is the count that entered title and abstract screening, and it must equal records identified minus records removed: 2,959 − 664 = 2,295.
Records excluded counts final decisions after disagreements are resolved, once per record and never once per reviewer: 1,918 in V1, leaving 377. PRISMA 2020 asks for no reasons at this stage. The template adds one request in a footnote: if a tool excluded records during screening, report how many a human excluded and how many the tool excluded.
Reports sought and not retrieved
Reports sought for retrieval is the full-text request list: every record that passed title and abstract screening. Reports not retrieved counts the ones the team could not obtain, whatever the reason. Typical causes: a journal outside the local collection and out of reach of interlibrary loan, authors who never replied, and broken links.
An unobtainable report is a limitation of the review, reported as one. It never counts as an exclusion, because nobody assessed it. V1 seeks 377, fails to retrieve 22, and assesses 355.
Reports excluded, with reasons
Every report assessed in full text either goes forward or is excluded for one primary reason, chosen from a fixed list written into the protocol. The reason is recorded when the report is set aside, in the full-text decision log or the tool’s exclusion field.
V1 lists four reasons: wrong population 141, wrong comparator 88, no outcome data 47, and conference abstract only 31. They add to 307, and 355 − 307 leaves 48 reports going forward. Item 16b of the checklist also asks you to cite studies that might appear to meet the criteria but were excluded, and to say why.
Studies and reports included
A trial published as a three-month paper and a two-year follow-up is one study and two reports. The studies figure counts each investigation once, so it can equal the reports figure or fall below it, never exceeding it. Reports from both columns meet at this box. V1 records 48 studies in 52 reports, and 48 of those reports leave full-text assessment in the first column. The other four reach this box from the second column, which V1 does not draw.
Where PRISMA counts stop reconciling
Three errors send a diagram back, and each shows up to anyone who adds up the boxes. V2 pairs each with a corrected version, using a smaller illustrative review of 1,903 records.
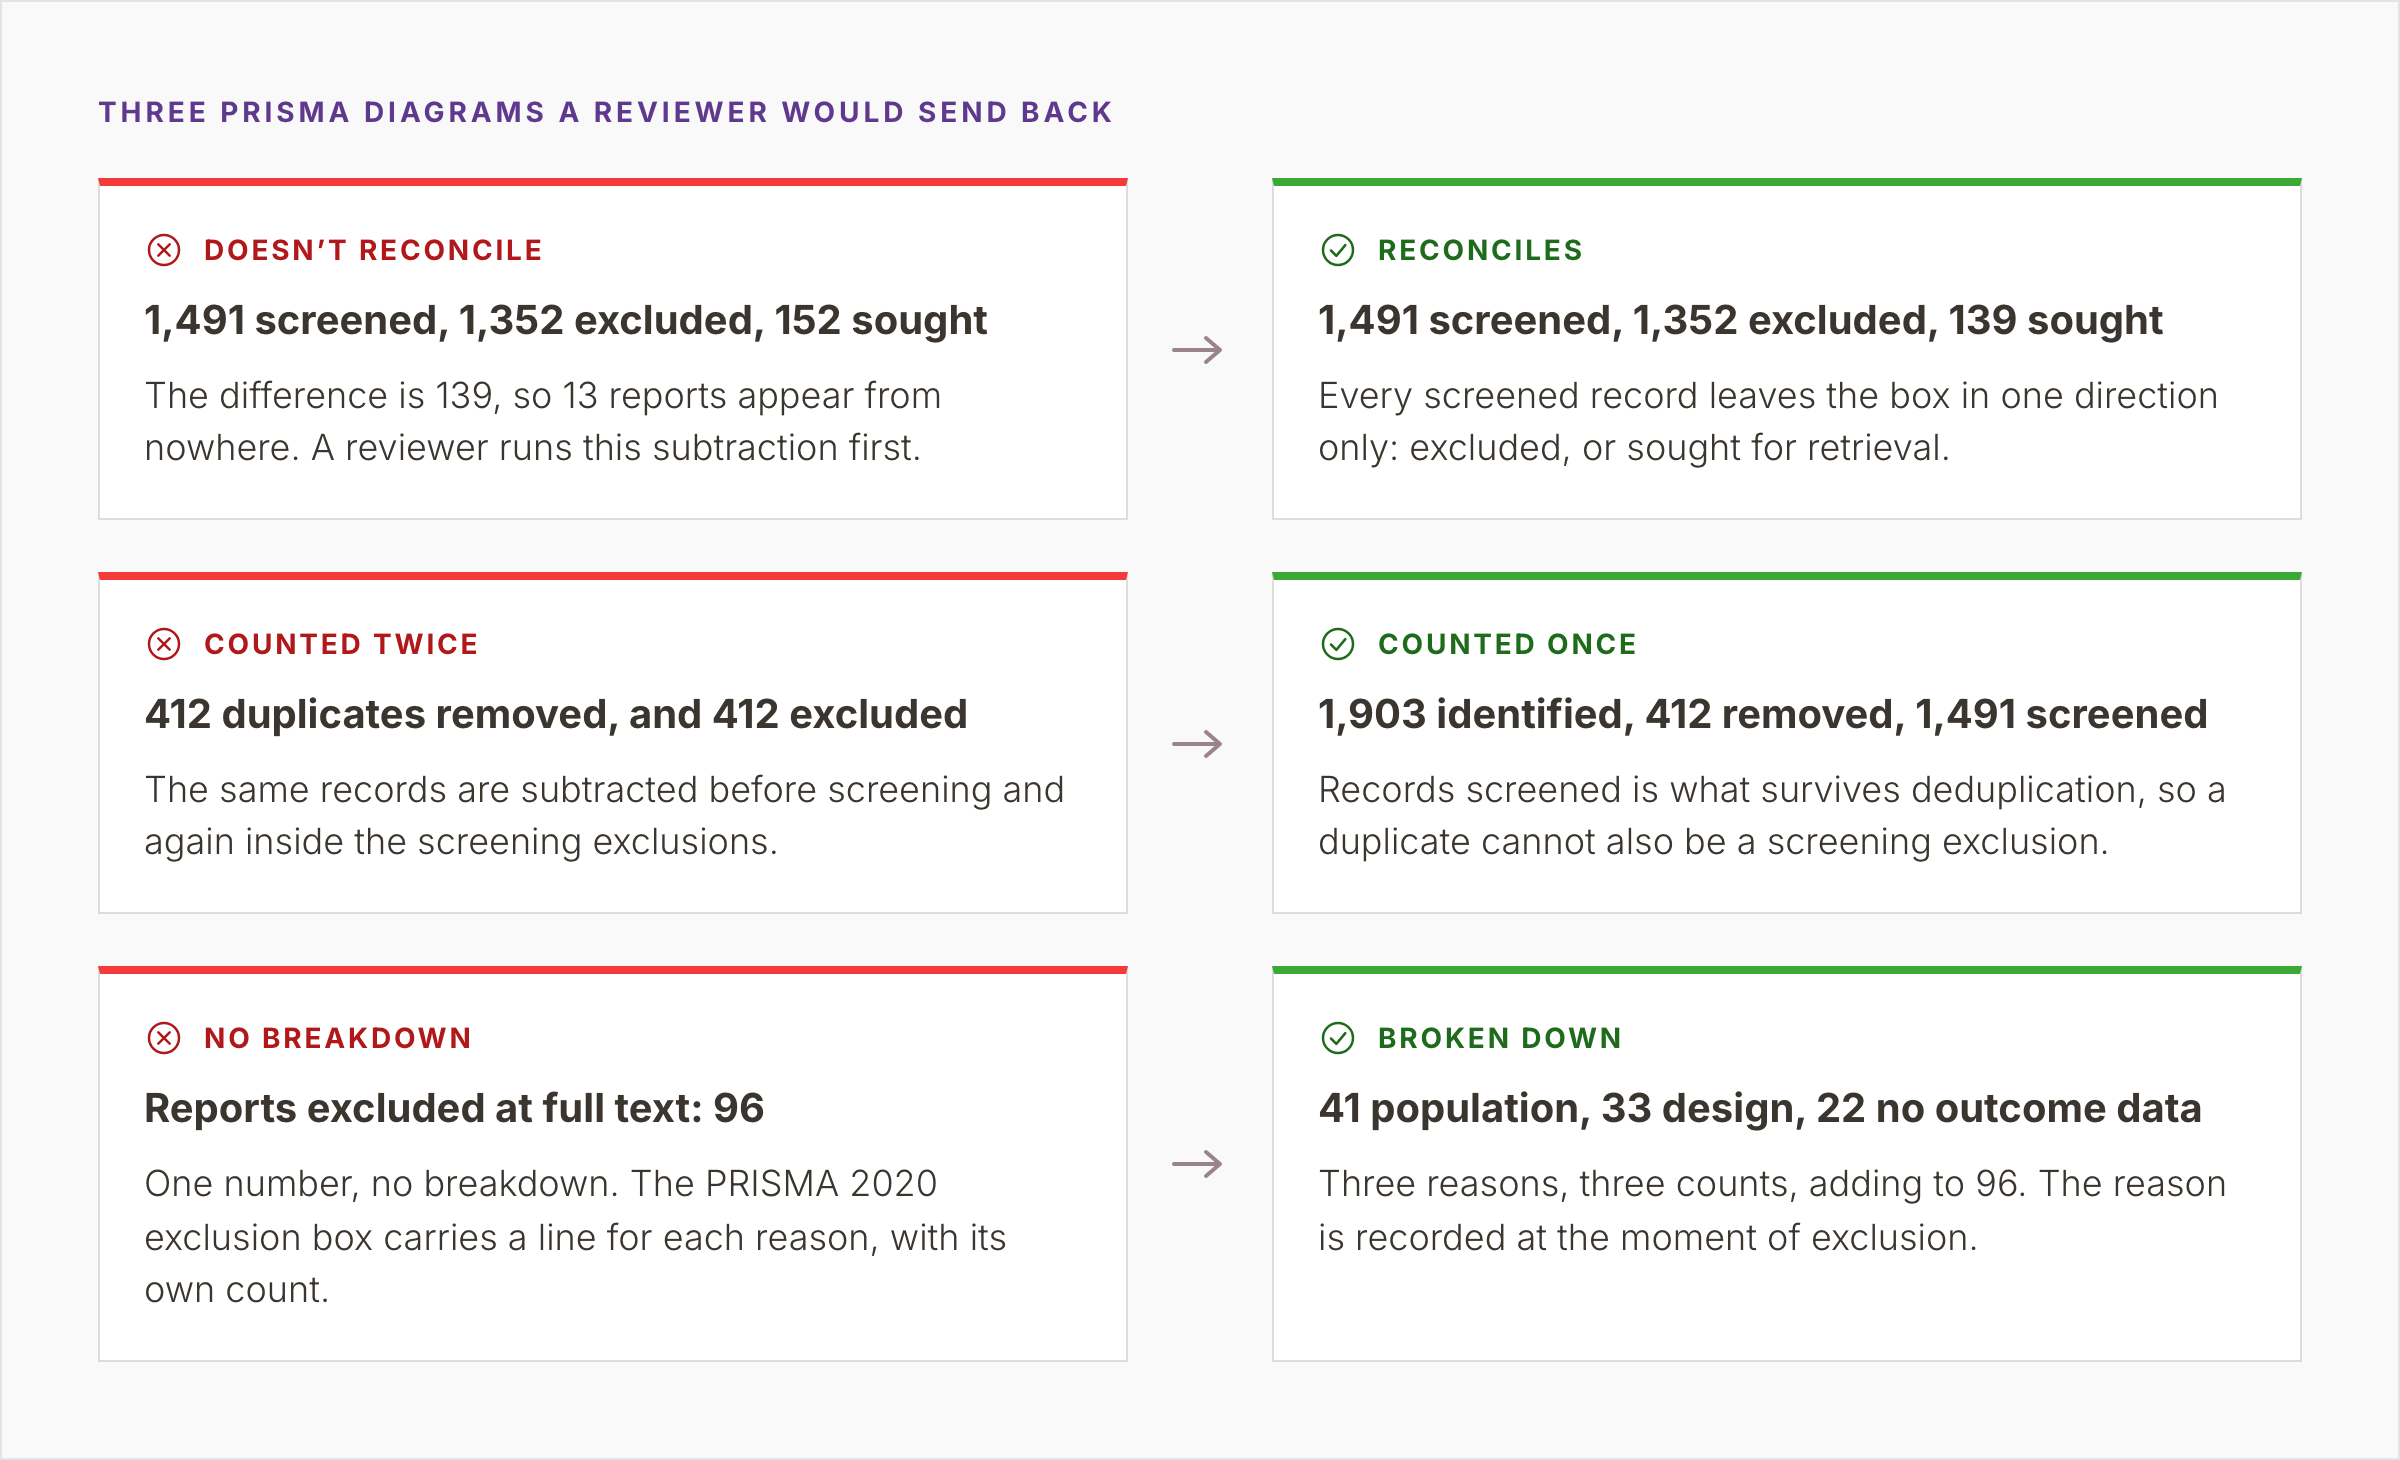
Figure 2. Three flow diagram errors, each paired with a corrected version: exclusions that do not leave the number sought, duplicates counted twice, and full-text exclusions given as one total.
Exclusions that leave the wrong number sought
“1,491 screened, 1,352 excluded, 152 sought.” The difference between the first two is 139, so 13 reports appear from nowhere. A reviewer runs this subtraction first. It can happen when counts are pulled on different days. Records from an update search pass screening after the screened and excluded counts were taken, and only the sought count picks them up.
The corrected diagram shows 139 sought. Every screened record leaves the box in one direction only: excluded, or sought for retrieval.
Duplicates counted twice
“412 duplicates removed, and 412 excluded.” The same records are subtracted before screening and again inside the screening exclusions. The exclusions grow by 412, and screened minus excluded no longer equals sought.
The corrected version reads 1,903 identified, 412 removed, 1,491 screened. Records screened is what survives deduplication, so a duplicate cannot also be a screening exclusion. A duplicate found late during screening still counts once: either with duplicates removed or with records excluded, and the methods say which.
Full-text exclusions without a breakdown
“Reports excluded at full text: 96.” One number, no breakdown. The PRISMA 2020 exclusion box carries a line for each reason with its own count. The corrected version gives 41 for population, 33 for study design and 22 for no outcome data, adding to 96.
NICE and Cochrane both ask for more than the diagram. The NICE manual asks for every study excluded after full-text checking to be listed with its reason. Chapter III of the Cochrane Handbook asks authors to list apparent near-misses under “Characteristics of excluded studies,” each with an explicit reason.
What changed from PRISMA 2009 to PRISMA 2020
The 2020 statement says the 2009 version should no longer be used. Anyone starting from a 2009 file will find nowhere to put several counts that 2020 expects.
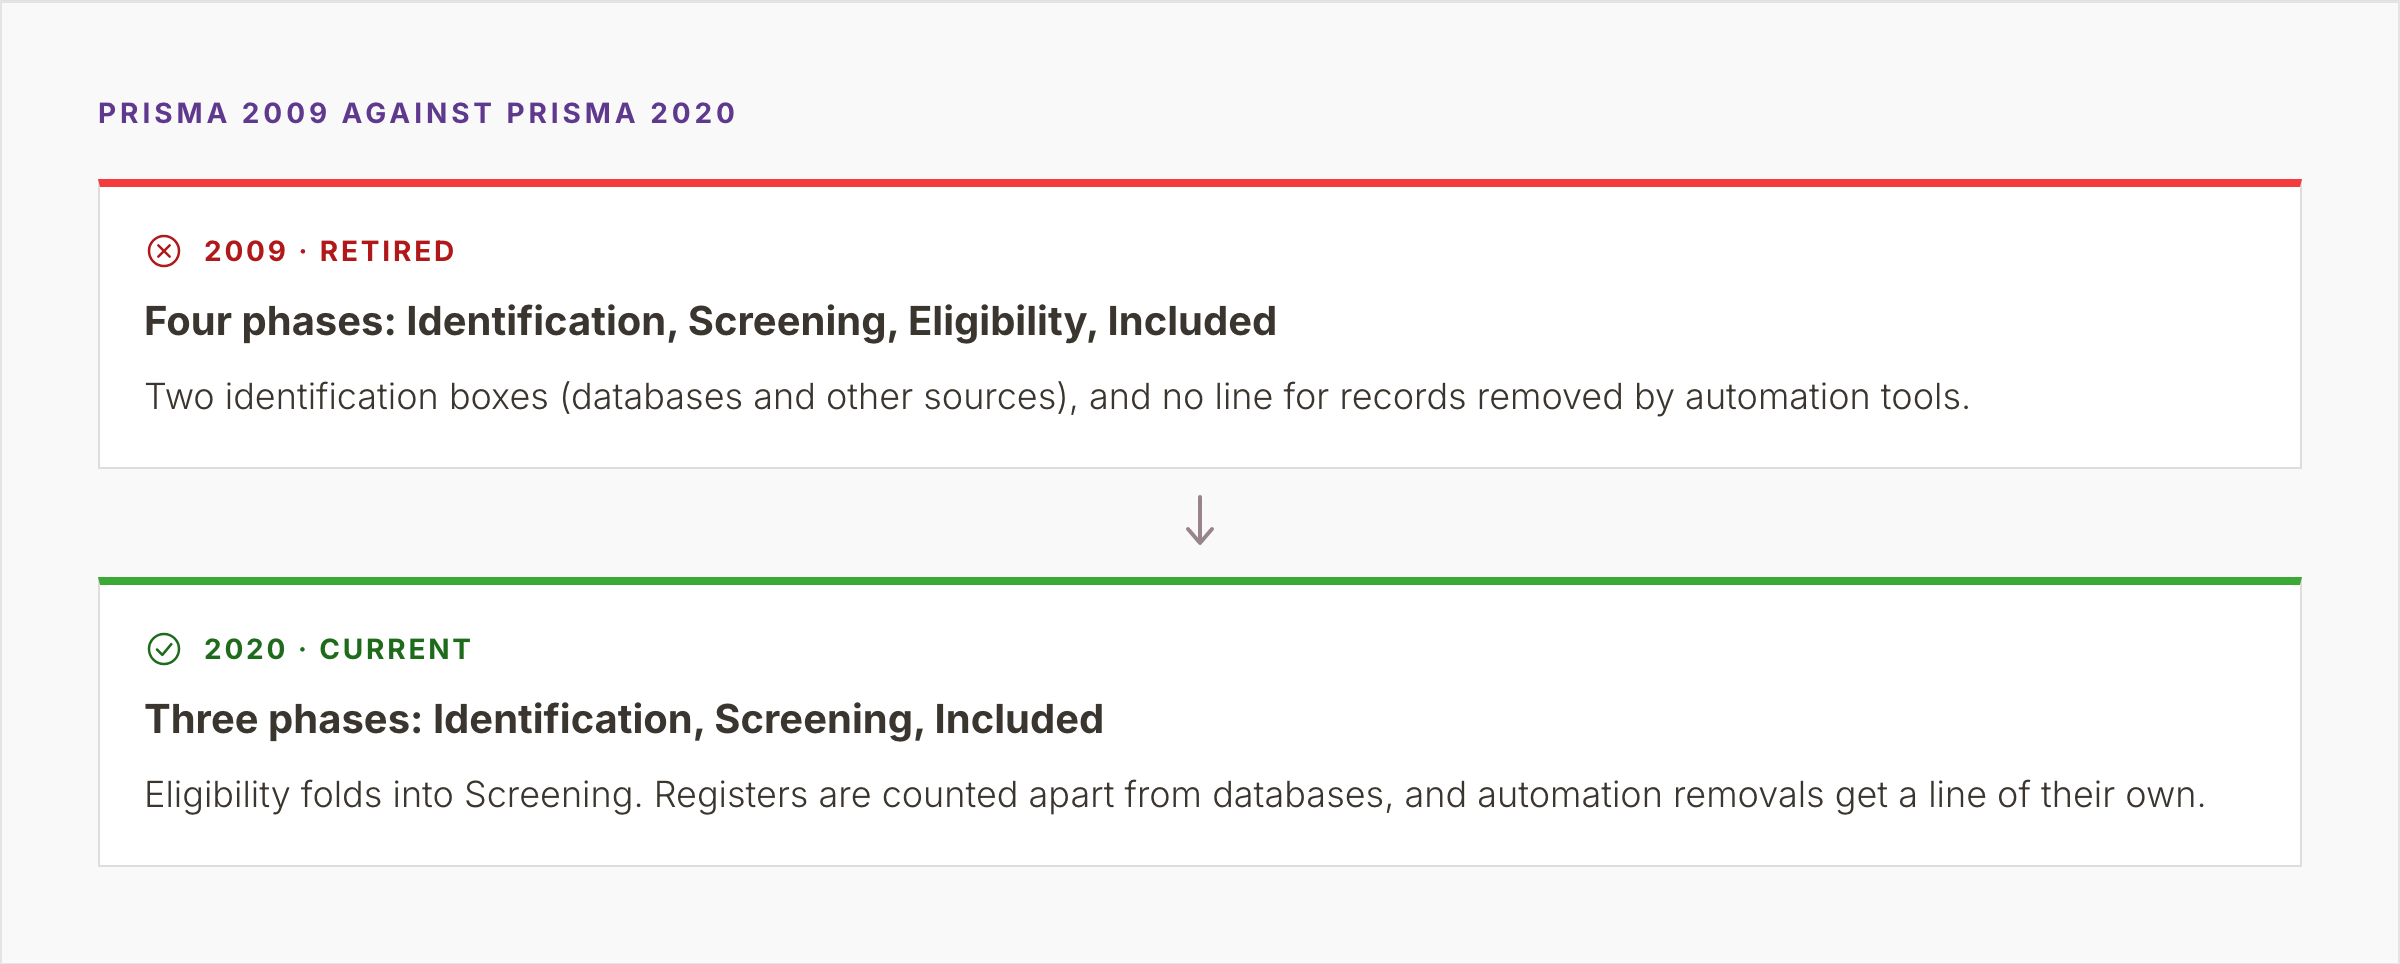
Figure 3. The retired four-phase 2009 diagram above the current three-phase 2020 diagram, with registers counted apart and a line for automation removals.
Eligibility folded into Screening. The 2009 diagram ran four phases: Identification, Screening, Eligibility, and Included. The 2020 diagram runs three: Full-text assessment still happens under Screening as reports sought, not retrieved, assessed, and excluded.
Registers and other methods counted apart. The 2009 diagram had two identification boxes: database searching, and other sources. The 2020 diagram counts databases and registers on separate lines of the first column. Websites, organisations, and citation searching get a column of their own. Rethlefsen and Page note that the 2009 “other-sources” box often held only the records that met the inclusion criteria; the 2020 column expects every record identified from each source.
Removals counted instead of survivors. The 2009 diagram recorded “records after duplicates removed.” The 2020 diagram records what was removed, on three lines: duplicates, automation, and other reasons. The checklist changed with it: item 8 now asks for details of any automation tools used in selection.
Reports, studies, and four templates
The 2009 diagram counted “full-text articles.” The 2020 diagram counts reports, adds a box for reports not retrieved, and ends with studies and reports of those studies. Rethlefsen and Page explain why: diagrams that jumped from reports assessed to studies included left some reports unaccounted for. The 2009 split of included studies into qualitative and quantitative synthesis is gone.
PRISMA 2020 also offers four templates in place of one: new or updated review, each with or without sources beyond databases and registers. Rethlefsen and Page expect most teams to need the template for new reviews that searched databases, registers, and other sources.
The PRISMA family: PRISMA-ScR, PRISMA-P, and PRISMA-S
PRISMA 2020 covers systematic reviews and meta-analyses with 27 items and the diagram. Three extensions cover the work around it and the PRISMA site lists more for diagnostic accuracy, network meta-analysis, and individual participant data, among others.
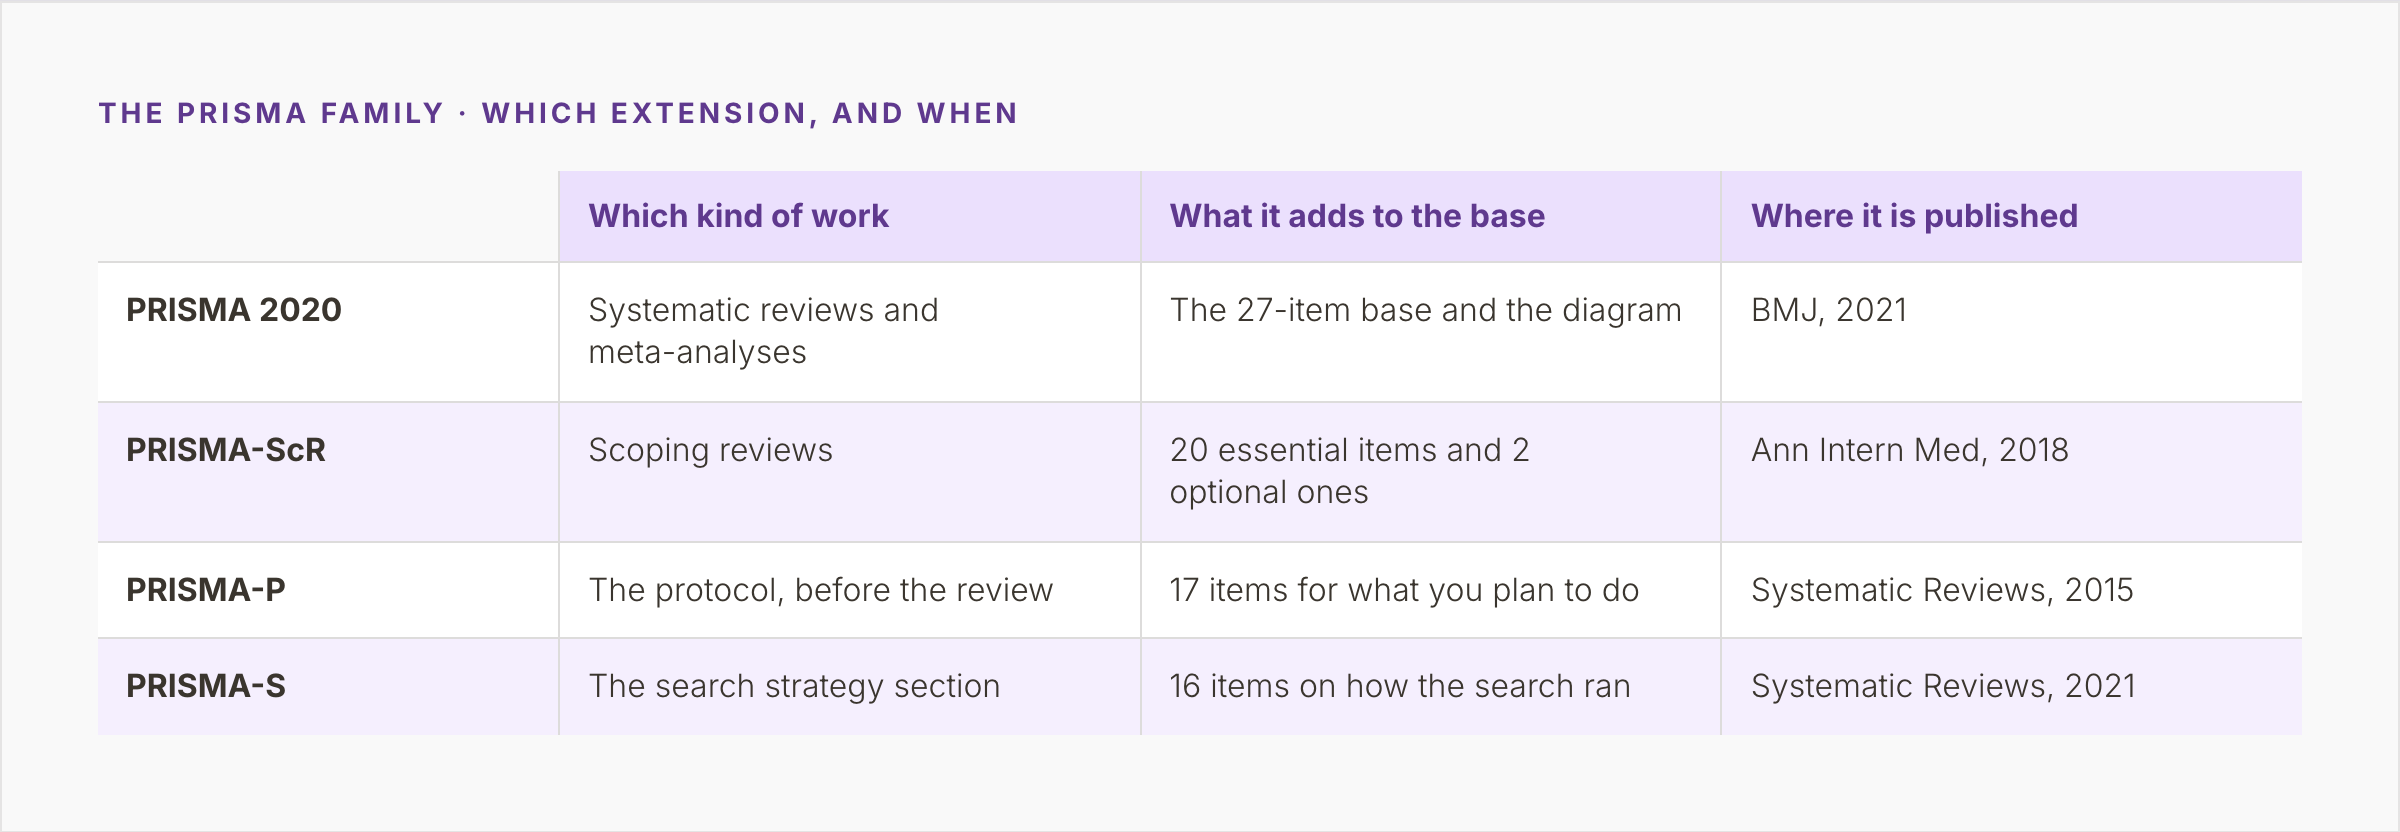
Figure 4. PRISMA 2020 and three extensions, with the kind of work each covers, what it adds to the base, and where it was published.
PRISMA-ScR covers scoping reviews. Tricco and colleagues published it in Annals of Internal Medicine in 2018: 20 essential items and 2 optional ones. Critical appraisal is among the optional items, so no risk-of-bias item is required. Item 14 asks for the numbers of sources screened, assessed, and included, with reasons for exclusion at each stage, ideally in a flow diagram. A PRISMA-ScR flow diagram therefore carries the same arithmetic. Its wording asks for reasons at every stage, where PRISMA 2020 asks for them only for reports.
PRISMA-P covers the protocol, before the review starts. Moher and colleagues published its 17 items in Systematic Reviews in 2015, with an explanation paper in The BMJ.
PRISMA-S covers the search section. Rethlefsen and colleagues published its 16 items in Systematic Reviews in 2021: databases, platforms, strategies, dates, total records per source, and deduplication. NICE uses PRISMA-S to inform search reporting in its guideline work. PRISMA-S appeared shortly before PRISMA 2020, so its example diagram follows the 2009 layout. Rethlefsen and Page describe the two as compatible with a few adjustments.
The choice follows the work. A scoping review reports against PRISMA-ScR. A systematic review reports against PRISMA 2020, with the option to add PRISMA-S for its search section, and writes its protocol against PRISMA-P.
The PRISMA 2020 checklist and the abstract checklist
The PRISMA 2020 checklist has 27 items in seven sections; some with sub-items, and an expanded checklist sets out what each item asks for. Each row has a column for the page or section where the item is reported. A Shiny app linked from the PRISMA site completes the checklist and exports it to Word or PDF. Item 16a is the diagram’s home: describe the search and selection process from records identified to studies included, ideally with a flow diagram. The wording PRISMA suggests for journals’ instructions to authors makes a completed checklist and flow diagram a condition of submission.
The PRISMA 2020 for Abstracts checklist has 12 items and updates the 2013 PRISMA for Abstracts. Item 7 asks the abstract to give the total number of included studies and participants in the bottom box of the diagram. Item 4 asks for the information sources and the date each was last searched, and item 12 for the registration number.
PRISMA 2020 is a reporting guideline. The statement says it is not intended to guide how a review is conducted, nor should it be used to judge a review’s methodological quality. A review called a “PRISMA literature review” is a systematic review reported against this checklist. Its methods come from the Cochrane Handbook, the JBI Manual, or a comparable source.
Building a PRISMA flow diagram
The PRISMA site offers the four PRISMA 2020 templates as Word files. Pick the one that matches your searches, and remove any gray box that does not apply, as the statement instructs. The PRISMA 2020 guidelines and templates carry a CC BY 4.0 licence, so reuse needs a citation and no permission.
Cochrane authors can build the diagram in RevMan. The PRISMA2020 R package and Shiny app by Haddaway and colleagues draws one from a table of counts. The app now accepts counts for each database and register too. The Word templates can also be edited to list each database on its own line.
Drawing takes an afternoon. The counts take the whole review. V4 lists the ten counts a diagram needs. Each is cheapest to capture as it happens: the search count at the search, duplicates at deduplication, and the reason when a report is set aside.
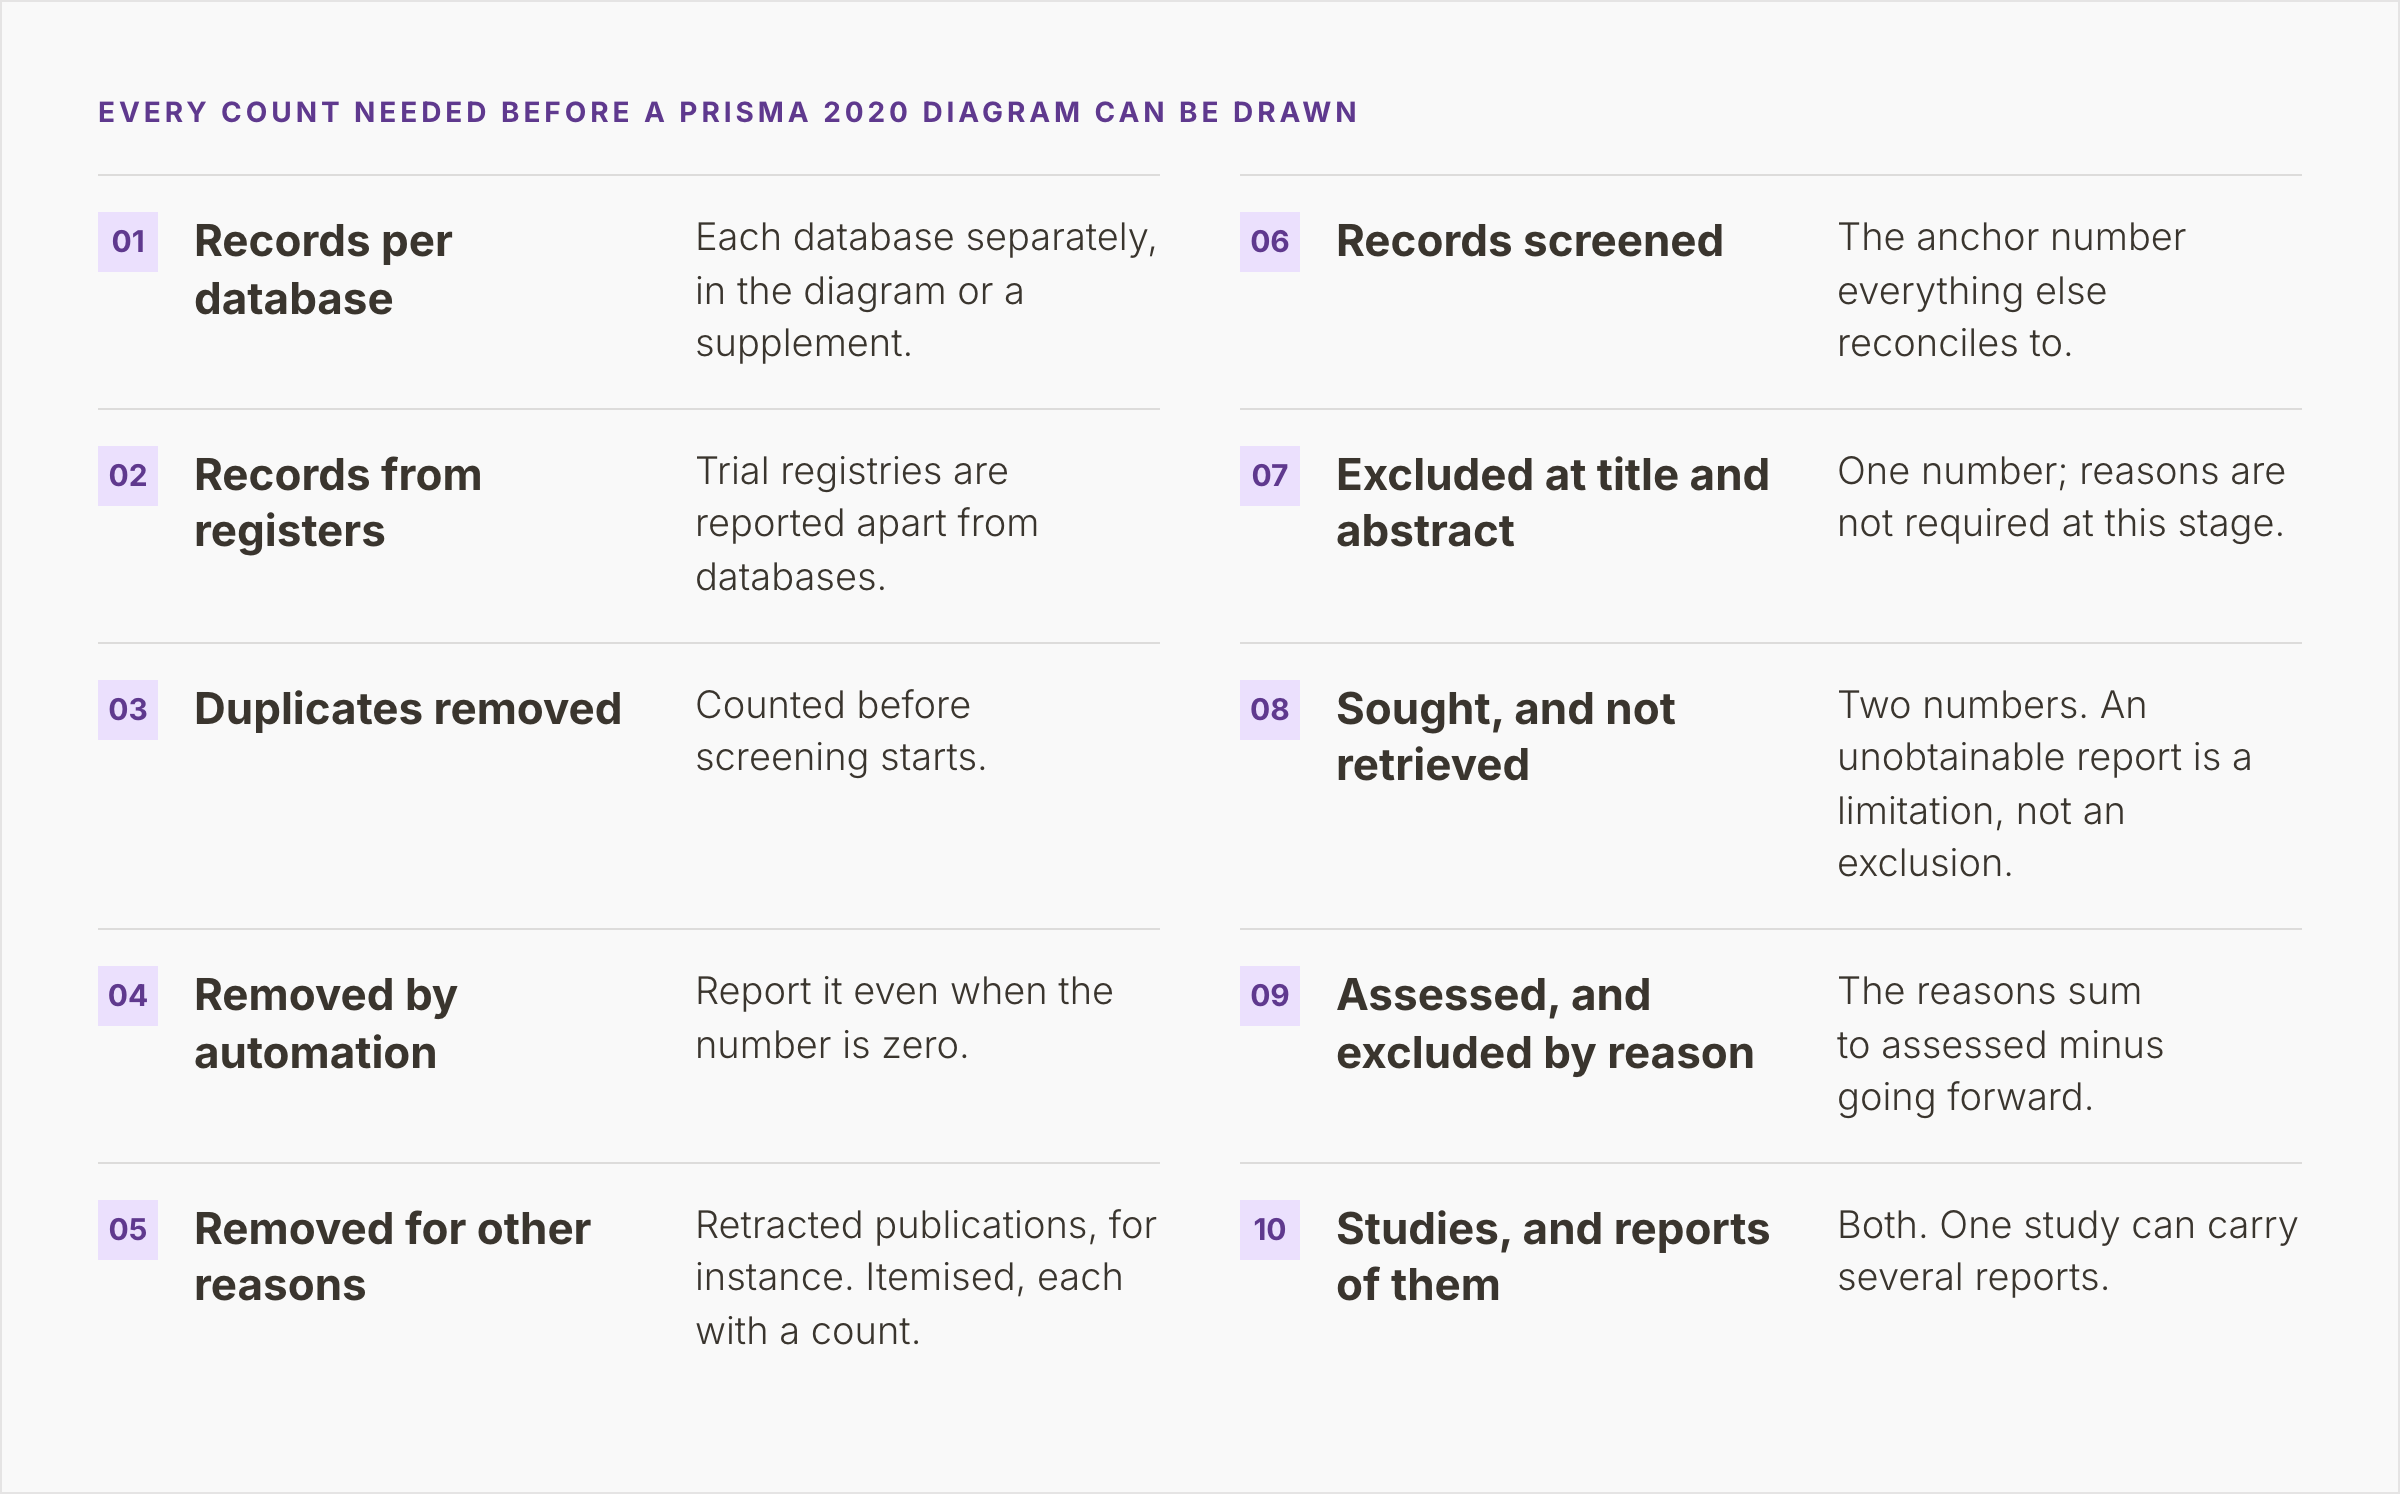
Figure 5. The ten counts to log during a review before the diagram can be drawn, from records per database to studies and reports included.
A count assembled in the final week is the one that comes apart. By then the screening tool, the reference manager, and the retrieval spreadsheet each hold a different version of events. Before submission, run the subtractions once. Identified minus removed equals screened. Screened minus excluded equals sought. Sought minus not retrieved equals assessed. The exclusion reasons sum to the difference between reports assessed and reports going forward.
PICO Portal keeps a PRISMA 2020 view of the screening counts as the review proceeds, labelled beta in its documentation. It exports them as a CSV for the PRISMA2020 app, where the team finishes the diagram. The counts stay current during screening instead of being rebuilt from several files at the end.
Where to go next
- Systematic review: what it is and how one is done. The eight stages that produce the counts in this diagram, and who owns each one.
- PRISMA 2020 flow diagram templates. The four official Word templates, for new and updated reviews.
- Cochrane Handbook, Chapter III. How Cochrane expects the results of the search and selection to be reported.
PICO Portal records each screening and full-text decision with its exclusion reason, and shows the PRISMA 2020 counts from that record. See how the workflow fits together.